 Releases RSS Feed
Usage
The chart module allows to replace data from an existing chart.
It supports following file types :
- Microsoft Word (
.docxformat) - Microsoft Powerpoint (
.pptxformat) - Microsoft Excel (
.xlsxformat), if you also have access to the xlsx module.
It supports following chart types :
- horizontal and vertical bar charts
- area charts
- line charts
- radar charts
- sunburst charts
- 3d views of all charts shown above
- scatterplot charts
- scatterplot charts with variable bubble sizes
- waterfall charts
- map charts
To use the module, you need to create a chart inside your document. That chart will keep all of its style, colors, …
With a specific docxtemplater tag, you will be able to tell that you want the data of the chart to be dynamic.
Chart types
Basic charts : Line charts, area charts
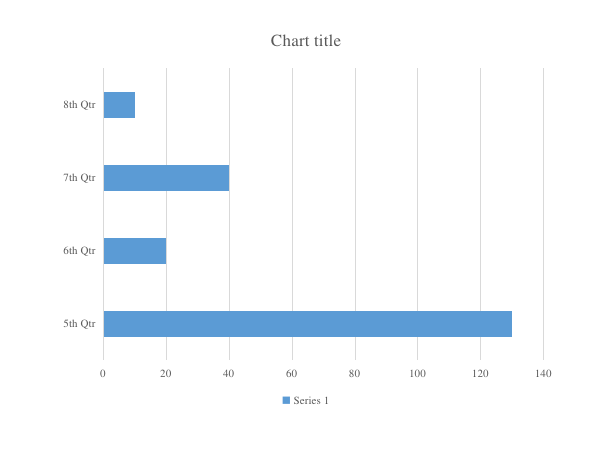
In Docx, you can place a paragraph after the chart that contains a tag starting with a $ sign, such as {$chart2} :
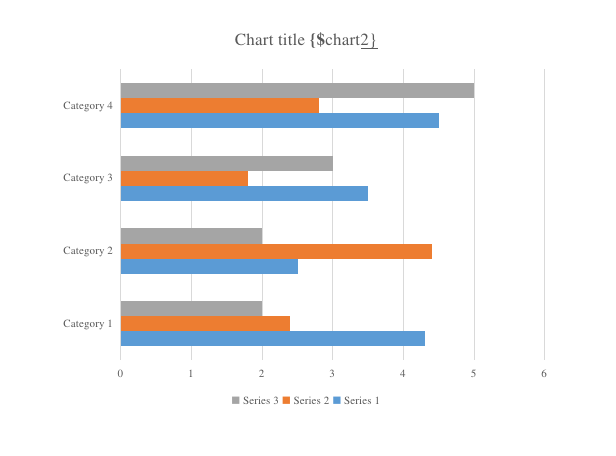
Then, in your code, you can write :
const ChartModule = require("docxtemplater-chart-module");

const doc = new Docxtemplater(zip, {
    modules: [new ChartModule({})],
});

doc.render({
    title: "The lorem chart",
    chart2: {
        categories: ["5th Qtr", "6th Qtr", "7th Qtr", "8th Qtr"],
        series: [{ data: [130, 20, 40, 10] }],
    },
});
Another way to tag a given chart is to write the tag {$chart1} inside the title of a given chart, like this :
The same mechanism works with bar charts, area charts, radar charts.
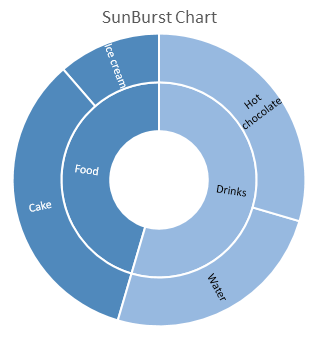
Sunburst charts
For sunburst charts, the data is recursive.
To fill in the data, the data structure is different from other charts.
Use this type of data in your code for sunburst charts :
doc.render({
    chart: {
        categories: [
            {
                name: "Drinks",
                categories: [
                    {
                        name: "Water",
                        value: 11,
                    },
                    {
                        name: "Hot chocolate",
                        value: 13,
                    },
                ],
            },
            {
                name: "Food",
                categories: [
                    {
                        name: "Cake",
                        value: 15,
                    },
                    {
                        name: "Ice cream",
                        value: 5,
                    },
                ],
            },
        ],
    },
});
All levels that contain multiple elements must declare categories, and the final node values should contain the name and value (integer) property.
It will generate following chart :
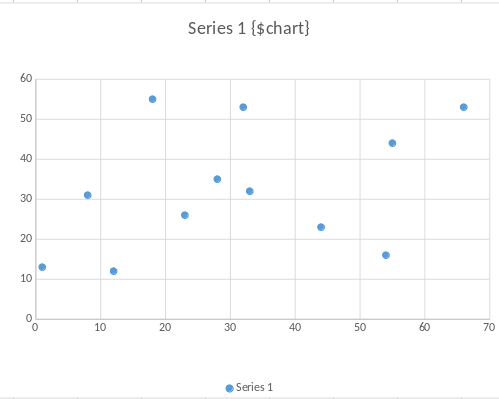
Scatterplot charts
For scatterplot charts (also called bubble charts), each data point has an "x" and a "y" value (and optionnally a size).
Here's an example input/output of a scatterplot cahrt :
To fill in the data, the data structure is different from other charts.
Use this type of data in your code for scatterplot charts :
doc.render({
    chart: {
        series: [
            {
                data: [
                    { x: 1, y: 100, size: 2 },
                    { x: 10, y: 40, size: 1 },
                    { x: 10, y: 33, size: 4 },
                    { x: 30, y: 22, size: 5 },
                ],
            },
        ],
    },
});
Note it is possible to also change the label shown on top of each item by specifying the name key :
doc.render({
    chart: {
        series: [
            {
                data: [
                    { x: 1, y: 100, size: 2, name: "Cars" },
                    {
                        x: 10,
                        y: 40,
                        size: 1,
                        name: "Bikes",
                    },
                    {
                        x: 10,
                        y: 33,
                        size: 4,
                        name: "Trains",
                    },
                    {
                        x: 30,
                        y: 22,
                        size: 5,
                        name: "Planes",
                    },
                ],
            },
        ],
    },
});
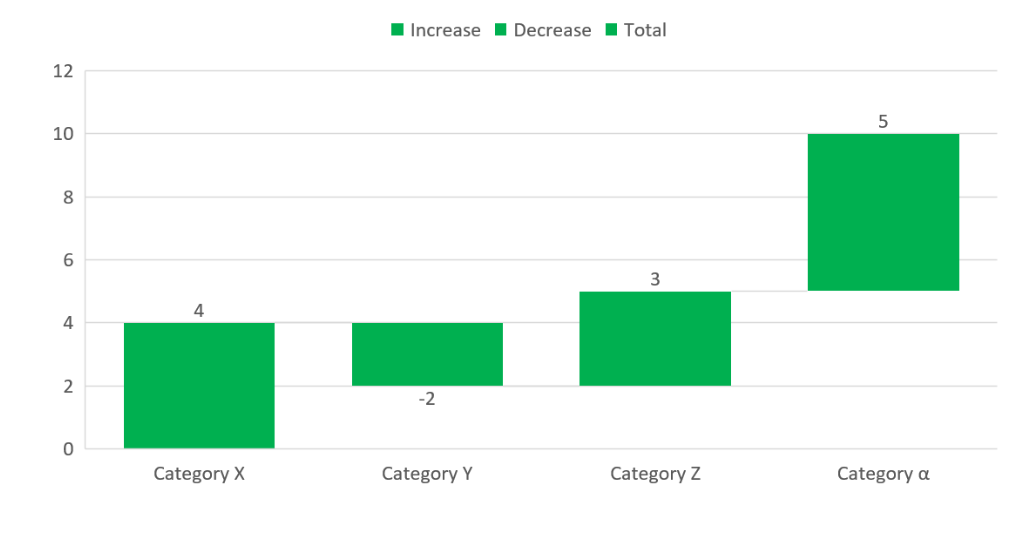
Waterfall charts
Use this type of data in your code for waterfall charts :
doc.render({
    chart: {
        categories: [
            "Category X",
            "Category Y",
            "Category Z",
            "Category α",
        ],
        /*
         * This is incremental data, in the chart, thanks to the
         * waterfall, it will show as 4,2,5,10
         */
        data: [4, -2, 3, 5],
    },
});
It will generate following chart :
Options
Categories with dates
If your x-Axis contains values that are actually dates, then, you'll also have to pass those values as dates to your data structure, like this :
function utc(y, m, d) {
    return new Date(Date.UTC(y, m, d));
}

doc.render({
    chart1: {
        categories: [
            utc(2017, 0, 13),
            utc(2017, 0, 14),
            utc(2017, 0, 15),
            utc(2017, 0, 16),
            utc(2017, 0, 17),
            utc(2017, 0, 18),
            utc(2017, 0, 19),
        ],
        series: [
            {
                title: "Serie 001",
                data: [1, 1, 4, "", 6, {}, 7.4],
            },
            {
                title: "Serie 002",
                data: [1, 2, 3, 4, 4, new Date(), 6.4],
            },
        ],
    },
});
Changing chart styles
You can also change the style of the generated charts.
At the current time, you can change the color of the title of the chart like this :
doc.render({
    chart: {
        styles: {
            title: {
                color: "#df3fd3",
            },
        },
        categories: ["A1", "B2", "C3", "D4"],
        data: [100, 200, 45, 40],
    },
});
The following style allows to change the holesize of doughnutcharts (value between 10 and 90) :
const chart = {
    styles: {
        doughnut: {
            holeSize: 11,
        },
    },
};
doc.render({
    chart,
});
Changing series color
You can use following code to change the color of a given series :
doc.render({
    chart: {
        categories: [1, 2, 3, 4, 5, 6],
        series: [
            {
                title: "Serie A",
                color: "#00ff00",
                data: [1, 2, 3, 4, 5, 6],
            },
            {
                title: "Serie B",
                color: "#ff0000",
                data: [4, 3, 3, 5, 2, 1],
            },
        ],
    },
});
Changing one datapoint color
You can use following code to change the color of one datapoint :
doc.render({
    chart: {
        categories: [1, 2, 3, 4, 5, 6],
        series: [
            {
                title: "Serie A",
                data: [
                    {
                        value: 2,
                        style: {
                            color: "#3ffe71",
                            strokeColor: "#FF0088",
                            strokeWidth: 1,
                        },
                    },
                    5,
                    {
                        value: 1,
                        style: {
                            color: "#fe713f",
                            strokeColor: "#FF0088",
                            strokeWidth: 6,
                        },
                    },
                    {
                        value: 3,
                        style: {
                            color: "#71fe3f",
                            strokeColor: "#FF0088",
                            strokeWidth: 3,
                        },
                    },
                    {
                        value: 4,
                        style: {
                            color: "#773e1f",
                            strokeColor: "#FF0088",
                        },
                    },
                    12,
                ],
            },
        ],
    },
});
Other options
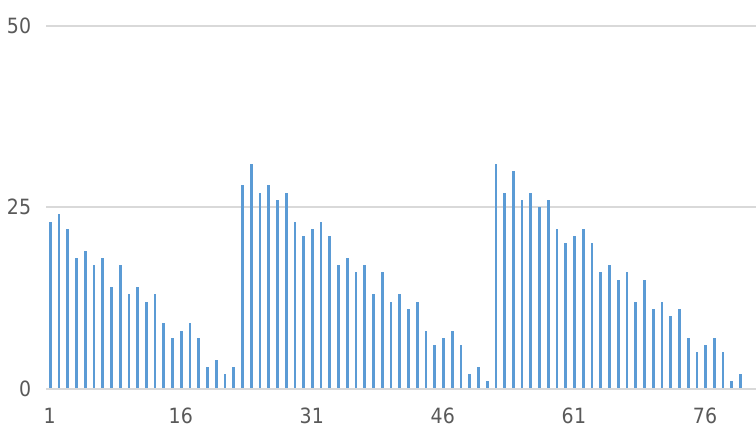
It is possible to configure some options to change the categoryAxis ad the valueAxis, for example to change the text shown on the axis, it is possible to use the following options :
const ChartModule = require("docxtemplater-chart-module");
const doc = new Docxtemplater(zip, {
    modules: [new ChartModule({})],
});

doc.render({
    chart: {
        categories: [1, 2, 3, 4, 5, 6],
        series: [
            {
                title: "Serie A",
                data: [1, 2, 3, 4, 5, 6],
            },
        ],
        options: {
            categoryAxis: {
                tickLabelSkip: 15,
            },
            valueAxis: {
                majorUnit: 25,
            },
        },
    },
});
will render the following :
With the options, it is also possible to change the numFmt, which for example allows to replace "$" by "€" in your chart, like this :
const ChartModule = require("docxtemplater-chart-module");
const doc = new Docxtemplater(zip, {
    modules: [new ChartModule({})],
});

doc.render({
    chart: {
        /*
         * categories: [...],
         * series: [...],
         */
        options: {
            valueAxis: {
                numFmt: (formatCode) =>
                    formatCode.replace(/\$/g, "€"),
            },
        },
    },
});
Configuring a given chart type
It is possible to configure the axis position and direction by using following code :
doc.render({
    chart: {
        /*
         * categories: [...],
         * series: [ ... ],
         */
        options: {
            horizontalBarChart: {
                valueAxis: {
                    position: "top",
                },
                categoryAxis: {
                    position: "right",
                    orientation: "minMax",
                },
            },
            verticalBarChart: {
                valueAxis: {
                    position: "right",
                },
                categoryAxis: {
                    position: "top",
                    orientation: "minMax",
                },
            },
        },
    },
});
This will ensure that if the chart is a "horizontalBarChart", the axis numbers will be shown at the top, and the categories on the right.
The orientation can be "minMax" or "maxMin" and determines if the order of that axis should be from min to max or from max to min.
It is also possible to specify this as a global object to the chart module like this :
const ChartModule = require("docxtemplater-chart-module");

const doc = new Docxtemplater(zip, {
    modules: [
        new ChartModule({
            horizontalBarChart: {
                valueAxis: {
                    position: "top",
                },
                categoryAxis: {
                    position: "right",
                    orientation: "minMax",
                },
            },
            verticalBarChart: {
                valueAxis: {
                    position: "right",
                },
                categoryAxis: {
                    position: "top",
                    orientation: "minMax",
                },
            },
        }),
    ],
});
doc.render();
Errors
The errors that can be thrown by the chart module are all described below :
Error : missing_linked_chart
This error is thrown if you have a chart tag like {$chart} but there is no chart near that tag.
Error Properties
error.id = "missing_linked_chart"
error.explanation = `Missing chart element near to '$${part.value}'`
Error : scatterplot_size_on_scatterplot_without_size
This error is thrown if you have a scatterplot chart in your template that has no sizes, and your data provides sizes.
Error Properties
error.id = "scatterplot_size_on_scatterplot_without_size"
error.explanation = "Cannot use data source with sizes on scatterplot without sizes"
Error : scatterplot_without_size_on_scatterplot_with_size
This error is thrown if you have a bubble chart chart with sizes in your template, and your data does not provide the sizes.
Error Properties
error.id = "scatterplot_without_size_on_scatterplot_with_size"
error.explanation = "Cannot use data source without sizes on scatterplot with sizes"
Error : invalid_data_source_numbers_scatterplot
This error is thrown if you have a bubble chart in your template, but your data does is not of the correct shape. The shape must be [{x: 33, y: 22}]
Error Properties
error.id = "invalid_data_source_numbers_scatterplot"
error.explanation = "Cannot use data source with numbers only for scatterplot graph"
Error : chart_data_invalid
This error is thrown if the data that you pass to the template is not valid for the chart that it refers to.
Error Properties
error.id = "chart_data_invalid"
error.explanation = `Chart data is invalid for '${part.value}'`
CHANGELOG
3.21.1
Bugfix when used together with the XlsxModule, in rare cases, a corruption could occur for calcChain.xml
This update needs the XlsxModule 3.38.4 or higher
3.21.0
Make it possible to customize color of one data point, and strokeColor and strokeWidth.
3.20.2
Correctly throw error if having an unclosed tag inside a map chart.
3.20.1
lodash has been updated to version 4.17.23 to address a reported security vulnerability affecting the omit and unset functions (details: on this Github Advisory).
In our codebase, these functions are not used with user-controlled paths, meaning the vulnerability could not be exploited in our context. This update is applied as a precaution and to stay aligned with security best practices.
3.20.0
Add way to customize min/max or ticks of the valAx using this configuration :
const ChartModule = require("docxtemplater-chart-module");
const doc = new Docxtemplater(zip, {
    paragraphLoop: true,
    linebreaks: true,
    modules: [new ChartModule()],
});
doc.render({
    chart: {
        categories: [1, 2, 3, 4, 5],
        series: [{ title: "Serie A", data: [5, 2, 1, 3, 4] }],
        options: {
            valueAxis: {
                position: "right",
                min: -1,
                max: 10,
                tick: 1,
            },
        },
    },
});
3.19.1
Correctly remove the unused xlsx cells if the data passed to the array is smaller than the data in the template.
Don't throw an error if setting data to {} (empty object). Previously the error was : Cannot read properties "length" of undefined.
3.19.0
Verify that all options specified in the module's constructor are valid by ensuring the types are accurate, using Minizod, a library akin to Zod for type verification.
3.18.2
Bugfix for map charts, it should work even if not all input countries are present in the data.
In the past, a corrupt document would be generated.
3.18.1
For Map Charts and other extended charts, ensure that templating within the chart title functions correctly.
3.18.0
Add support for Map charts.
3.17.0
Add support for Waterfall charts.
3.16.1
Use new internal xmlContentTypes API (requires docxtemplater 3.55.1 or higher)
3.16.0
Make it possible to edit chart data, by having access to the data in the "part.currentData".
This can for example be used in the parser :
const ChartModule = require("docxtemplater-chart-module");
const expressionParser = require("docxtemplater/expressions.js");
const doc = new Docxtemplater(zip, {
    paragraphLoop: true,
    linebreaks: true,
    parser: expressionParser.configure({
        // postEvaluate requires docxtemplater 3.57.2 or higher
        postEvaluate(value, expr, scope, context) {
            /*
             * expr will be "chart1"
             * context.meta.part.currentData will be the chart data before the generation
             * value is the data that is in the scope, you could merge both data together
             */
            if (
                context.meta.part.module ===
                "open-xml-templating/docxtemplater-chart-module"
            ) {
                console.log(
                    "currentData",
                    context.meta.part.currentData
                );
                console.log("scopeValue", value);
                // return a computed value depending on the currentData and the scope data (value)
            }
            return value;
        },
    }),
    modules: [new ChartModule()],
});
doc.render(/* data */);
3.15.5
If putting a chart in an XLSX File, correctly update the data that is bound to the chart (this requires XLSX module 3.27.6).
3.15.4
In very rare cases, the chart module could produce output that would show an error message when opened with Excel.
This version now produces correct documents.
3.15.3
If using the module with xlsx file, and using xlsx module 3.27.2, you need to also upgrade your chart module.
3.15.2
Add missing lodash dependency in package.json
3.15.1
When using v4 constructor with an odt file, the following stacktrace would be shown :
(The correct stacktrace should be that it is an odt file which cannot be templated).
3.15.0
Add support to set serie.color from the data.
3.14.0
Series Titles
- Fixed: Series titles now correctly use the "title" specified in the data, even when the titles in the template are default titles.
Chart Colors
- Improved: When a template defines a gradient fill color for a chart, each new series now uses a distinct color.
- Previously, all series used the same color in this scenario.
3.13.9
Bugfix so that module works correctly even with charts inside xlsx files that do not reference any data in the xlsx file. It internally uses <c:numLit> instead of <c:numRef><c:numCache>.
3.13.8
Bugfix issue of multiple charts having incorrect data when placed inside a loop.
(This would happen most of the time in async mode, but could also appear in sync mode).
The data that was first used for the rendering would sometimes be used even for the second rendering.
This is now fixed in this version.
3.13.7
Add support to change doughnut holesize using style
3.13.6
For Excel files (XLSX), correctly move the charts down if there is a loop above the chart.
(This fix also needs xlsx module version 3.23.2 or higher)
3.13.5
Make it possible to use prefix from the constructor
3.13.4
Add typescript typings to be able to change the module prefix
3.13.3
Allow to template chart titles in xlsx files (async and sync mode).
3.13.2
Bugfix when used with error-location module : show error correctly
3.13.1
Add support to change name of bubble charts
3.13.0
Add support to change axis orientation and position.
3.12.5
Upgrade module to use NodeNext moduleResolution setting. See explanation here
3.12.4
Update to allow to change numFmt of charts, which allows to change the way numbers are shown in the axis.
3.12.3
Set module.priority in order to have no more issues related to module ordering
3.12.2
Throw specific error when not finding the chart that should be near the ${chart1} tag.
Bugfix error when using async mode :
at concatArrays (node_modules/docxtemplater/js/doc-utils.js)
3.12.1
Add options.valueAxis.majorUnit and options.categoryAxis.tickLabelSkip
3.12.0
Add support for sunburst charts.
3.11.5
Update to make module work when having only null data fields, like this :
doc.render({
    chart1: {
        categories: ["5th Qtr", "6th Qtr", "7th Qtr", "8th Qtr"],
        series: [
            {
                data: [null, null, null, null],
            },
        ],
    },
});
3.11.4
Update module.clone() internal to make module work well with subsegment module (passthrough module.prefix)
3.11.3
Bugfix when having multiple charts in the same slide, sometimes, the second chart title would be applied to all chart titles, not just the second chart.
3.11.2
Bugfix to correctly work with linecharts, which also use X-Y datasets.
For linecharts, each "line" uses a different X-Y dataset.
In previous versions, the "NaN" attribute would sometimes be set, causing an error for that chart when opening the result document in word.
3.11.1
Bugfix to work correctly with loop charts with charts on the same paragraph as the {$chart} tag.
3.11.0
Allow to use "{$chart}" tag inside the drawing.xml (not inside the title, but inside the content of the chart.
3.10.3
Bugfix Cannot read properties of undefined (reading 'getElementsByTagName')
This was happening on some occurences of charts.
The full stack trace was :
at moduleRender (node_modules/docxtemplater/js/render.js:9:30)
at node_modules/docxtemplater/js/render.js:26:26
at Array.map (<anonymous>)
at render (node_modules/docxtemplater/js/render.js:24:24)
at XmlTemplater.render (node_modules/docxtemplater/js/xml-templater.js:199:22)
at node_modules/docxtemplater/js/docxtemplater.js:427:21
at Array.forEach (<anonymous>)
at Docxtemplater.render (node_modules/docxtemplater/js/docxtemplater.js:421:32)
3.10.2
Bugfix to avoid changing title of series if the data provided does not define a title.
Previously, the title would be changed regardless of the data, like this :
If the first series was "My Data", the second would automatically be named "My Data 2", even if the second series had a name of "Something Else".
3.10.1
Make module work even when using chart that references an external xlsx file for the source.
3.10.0
Fix multiple bugs :
When one of the embeddings was a "xlsb" file, an error would be thrown. This happened because the module wasn't aware of the xlsb format. Now, the error won't be thrown, however, for those kinds of charts, the data will be changed only in the UI, but if you reopen the dataset, the old dataset will be present in the xlsb file, because it is too complex to handle.
When a scatterplot contains a scaling property with "max"/"min" values, the module will now update them to use the Max/min values of the dataset.
3.9.4
Fix following regression : Cannot read properties of undefined (reading 'nodeValue').
This happened when a title/category had an empty string.
3.9.3
Avoid possible issue of "Maximum call stack size exceeded"
3.9.2
When using the chart module inside a slide loop (using the slides module, the xlsx content of the chart was not updated correctly.
This made the data of the chart "reset" when trying to edit the data.
Now, the correct data is also put in the XLSX embedding.
3.9.1
The wrong Error was thrown when using an XY chart with multiple series :
Cannot use data source with sizes on scatterplot without sizes
doc.render({
    chart: {
        series: [
            {
                data: [
                    { x: 1, y: 100 },
                    { x: 10, y: 40 },
                    { x: 10, y: 33 },
                    { x: 30, y: 22 },
                ],
            },
            {
                data: [
                    { x: 2, y: 200 },
                    { x: 30, y: 40 },
                    { x: 40, y: 33 },
                    { x: 50, y: 22 },
                ],
            },
        ],
    },
});
This version now no more produces this error wrongfully.
3.9.0
Add support for creating multiple charts inside loops
3.8.0
Add support for updating charts in xlsx format (Requires also the xlsx module version 3.11.2).
3.7.1
Make browser version of the module use window.XMLSerializer.
This fixes the following issue : Failed to execute 'serializeToString' on 'XMLSerializer': parameter 1 is not of type 'Node'.
3.7.0
Avoid corruption of xlsx file, which had the impact of not being able to edit the data of the generated document
3.6.5
Bugfix corruption in the browser
3.6.4
Make module browser compatible.
Previously, the generated error was :
Uncaught (in promise) Error: nodebuffer is not supported by this browser
    at Object.exports.checkSupport (utils.js?1fae:314:1)
Now the error should no more appear.
3.6.3
Bugfix following error in async mode : Cannot set properties of undefined (setting 'filePath')
3.6.2
Some bugfixes when dealing with scatterplot charts (which have data in the format of [{x: 10, y: 5, size: 3}].
3.6.1
Add verification to check that data is an array of integers.
3.6.0
Bugfix : the module should work even when there are empty values in the template in the chart data.
Starting from this version, the module will also throw an error if the data is invalid (if the categories.length != series.data.length for example).
3.5.2
Bugfix : some charts were generated using the same data as other charts.
Now, multiple chart tags should fetch the correct data.
3.5.1
Add better support for async mode.
In previous versions, the error message would be :
TypeError: Cannot read properties of undefined (reading 'length')
at find (/node_modules/docxtemplater/js/scope-manager.js:19:21)
3.5.0
When updating a chart, the chart data contained in the embedded xlsx file will also be updated, meaning that when doing "Edit Data" on a chart, the updated data should appear now.
3.4.0
Allow to change title color of charts by using the styles property.
Make module compatible with docxtemplater@3.28.0. Please make sure to update docxtemplater to 3.28.0 at the same time you update this module. The internal change made is the use of the new matchers API which fixes bugs that were triggered depending on the order of the modules that are attached to the instance. Now the order of the modules should not matter as expected.
3.3.0
Make module compatible with docxtemplater@3.27.0. Please make sure to update docxtemplater to 3.27.0 at the same time you update this module
3.2.1
Bugfix to avoid corruption when looping over slide that has a chart
3.2.0
Bugfix to avoid corruptions when having 7 or more dataseries.
The coloring of the series now will use the accents/modifiers defined in the chart data.
3.1.1
Fix bug when using {$chart} tag in slide title : when the "{" and the "$chart" are internally not inside the same <w:t>, previously, the chart tag would go undetected (and the chart unreplaced).
First use the scope of the "chart" to set the title, instead of using the scope outside of the chart.
Meaning you can now write :
And in your data :
const ChartModule = require("docxtemplater-chart-module");
const data = {
    chart1: {
        title: "My custom title",
        categories: ["5th Qtr", "6th Qtr", "7th Qtr", "8th Qtr"],
        series: [{ data: [130, 20, 40, 10] }],
    },
};
const doc = new Docxtemplater(zip, {
    modules: [new ChartModule({})],
});
doc.render(data);
(Previously the title would then resolve to undefined.)
3.1.0
Make it possible to have multiple charts in one pptx slide.
Make it possible to put the {$chart} tag in the title of the chart
3.0.2
Use @xmldom/xmldom instead of xmldom, see this github issue
3.0.1
Generate files in built with correct filename In previous versions, the filename was always build/docxtemplater.js. Now the filename is build/chart-module.js The .min.js file is also created now.
3.0.0
- Initial version of the Chart module